
4.5 More on this topic
The history of statistics began in the 17th century with William Petty’s Down Survey. This cadastral survey of Ireland, carried out in 1655-1656, was intended to facilitate the precise redistribution of Irish land confiscated by the English. The name Down Survey is thought to have been chosen by Petty either because the results were plotted on maps, or in reference to the surveyor’s chain that had to be “down” during the measurements. At the time, this work represented one of the most accurate cartographies and was the first British imperial topographical survey of an entire conquered territory. (Wikipedia)
This founding example perfectly illustrates the birth of statistics: a tool developed to meet the State’s need to collect data in order to administer the population and the economy. This dimension is reflected in the very etymology of the word “statistics”, derived from the Latin “statisticum” (affairs of state), a term introduced into German by Gottfried Achenwall in the form “Statistik”. Over the course of the 19th century, these methods diversified and were applied to many fields, considerably broadening their scope of application. (Vogt & Osipenko)
Statistical understanding developed gradually. Probability theory was first explored by Christiaan Huygens in 1657, followed by Roger Cotes’ error theory in 1722 (published posthumously). Major advances were made by a number of scientists, including Jakob Bernoulli, Abraham de Moivre, Thomas Simpson and Pierre-Simon Laplace, culminating in Andrei Kolmogorov’s probability axioms in the 20th century.
Florence Nightingale, famously known as the “Lady with the Lamp”, was much more than just a nurse. A talented mathematician and statistician, she was also a pioneer in the fields of data science and data visualisation.
Born into a wealthy family on 12 May 1820, Florence received a careful education under the supervision of her father. He taught her not only subjects appropriate for Victorian women, such as drawing and needlework, but also traditional academic subjects. From an early age, Florence showed an exceptional passion for learning.
Her early interest in statistics can be seen in a letter to her grandmother, in which the young Florence meticulously listed the animals she had observed during her visits to the Zoological Society, already demonstrating her taste for collecting and organising data:
Dear Grandmama. The baby is pretty. I have been to the Zoological Society twice. There are 2 leopards, 2 bears, 2 parrots, 2 emeus (which are very large birds), 2 rabbits. 1 lion, 2 cockaatoos, 3 squirrells, 4 kanguroos, 6 monkies, (3 in a cage, 3 chained to a pole with a little house at the top). 1 rattel, (a very fierce creature), several Esquimaux dogs, Captain’s Parry’s Esquimaux dog, 1 guinea pig, 1 Costi Monti, 3 llamas, (1brown one, 1 white one, & a small brown one), & other creatures that I forget the name of.1
Although she excelled in all subjects, her real passion remained mathematics. Her sister Parthenope testified to this devotion when she wrote: (Bostridge, 2008):
Florence has taken up mathematics – and as with everything she does, she puts her heart and soul into it and works hard.
Rejecting the conventional fate of a housewife, Nightingale aspired to a profession related to statistics. To circumvent the restrictions imposed on women of her time, she chose to study nursing in Germany, one of the few acceptable professional paths for women. When the Crimean War broke out in 1853, she seized the opportunity to put her skills into practice and left as a nursing sister a year later.
During her two years in the Crimea, Nightingale undertook a radical transformation of military hospitals while supervising the work of the Royal Commission on Army Health. Working closely with several statisticians, she wrote numerous reports and articles. It was during this period that she earned her famous nickname, when The Times reported that she walked the wards at night, lamp in hand, looking after the wounded.

Her main mission was to highlight the deplorable conditions of soldiers and the shortcomings in the organisation of military statistics. Nightingale rigorously collected the relevant data, interpreted it accurately and developed innovative visualisations to communicate her findings effectively.
Diagrams are extremely useful for understanding certain vital statistical issues.
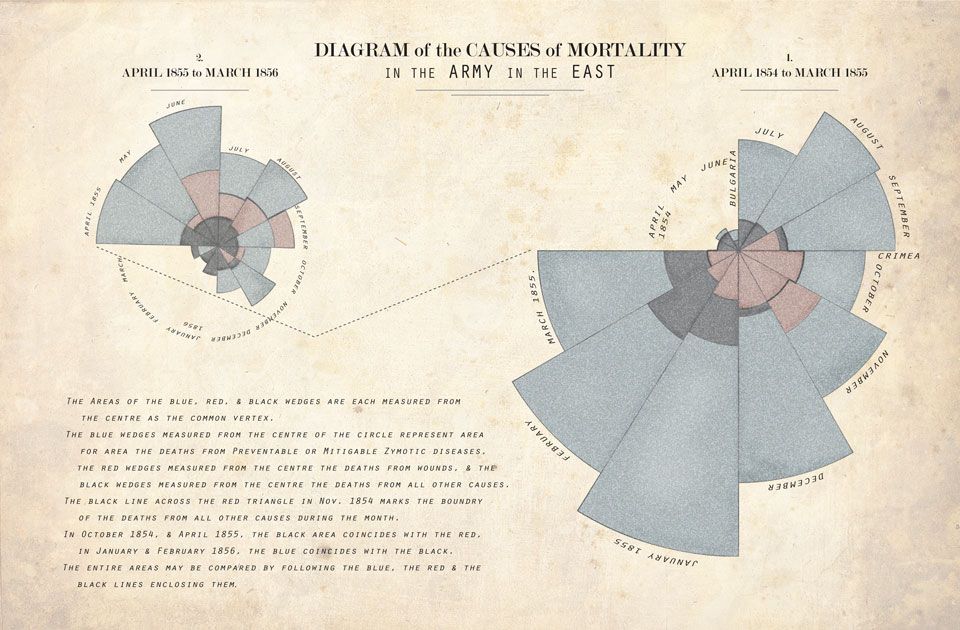
Source: Source: (Bradshaw, 2017)
Her diagrams revealed the appalling mortality in the British Army, identifying overcrowding, poor ventilation and unsanitary barracks as the main causes. To demonstrate the extent to which barracks were overcrowded, Nightingale created the following visualisation.
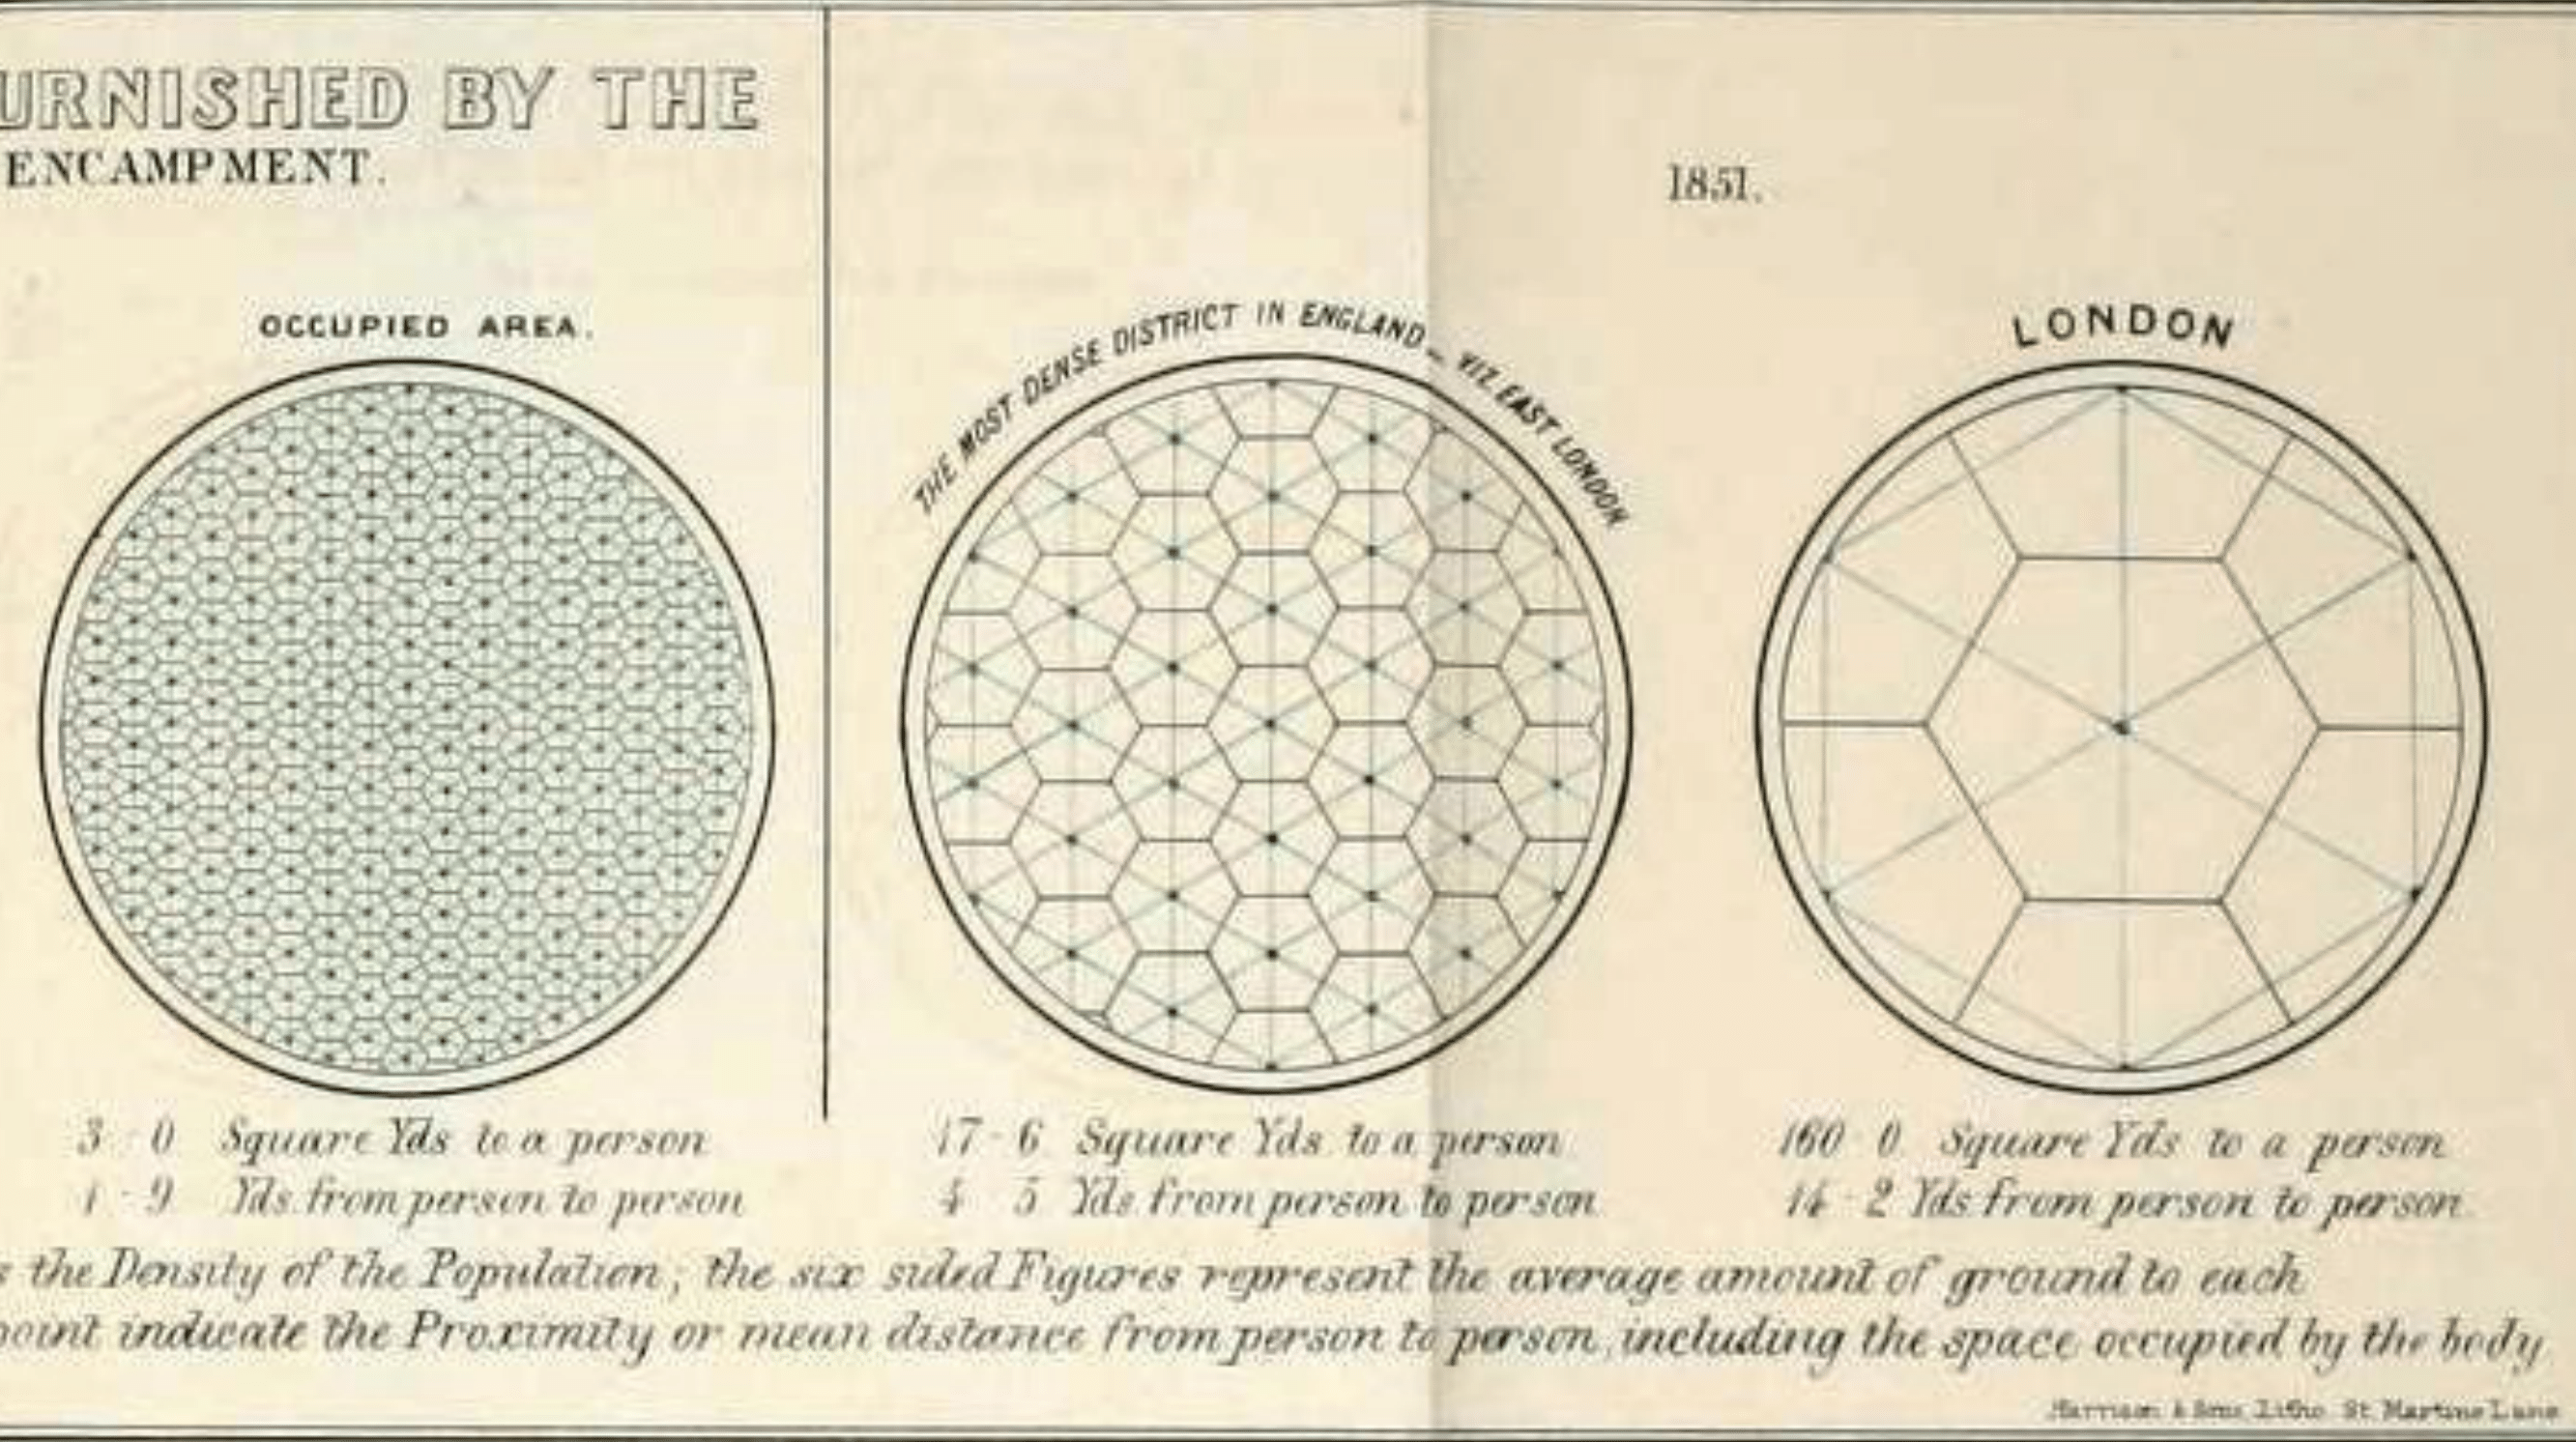
Source: Source: (Bradshaw, 2017)
Faced with the chaotic medical statistics of the British army, which she described as being “in great confusion”, Nightingale pleaded tirelessly for:
- Correct use of data
- The need to report information accurately
- Uniform collection of hospital statistics
Thanks to her perseverance, the army’s medical statistics were finally reorganised and a medical corps statistics channel was established.
Florence Nightingale remains a visionary figure whose impact on hospital reform and healthcare systems was considerable. Her pioneering approach, using diagrams to tell stories based on data, was revolutionary in its day, particularly for a woman. With her mastery of visualisations and rigorous data analysis, she can rightly be considered one of the first women to practise what we now call data science, laying the foundations for what is now an essential discipline.
For those interested, we refer you to Sarah Hart’s interesting lecture, The Mathematical Life of Florence Nightingale:
1 Nightingale, Florence. 1828. Letter to Grandmother. https://cwfn.uoguelph.ca/
Navigating the world of statistics can be complex, particularly when figures are presented in the media, politics, the economy or health, sometimes creating paradoxical situations. It is essential to examine these data carefully to avoid any misinterpretation. In the following video the famous Simpson paradox is explained.
The following, more concise video, produced by Lucie Zeches and Jean-Paul Bertemes for the Ziel mer keng series (with English subtitles), sheds light on the common statistical errors we encounter on a daily basis.
The MIDAS (Modelling, Interdisciplinary research, Data science, Applied mathematics and Statistics) team
at the University of Luxembourg, led by Professor Christophe Ley, aims to develop innovative statistical and machine learning procedures based on new mathematical and computer tools to meet the challenges posed by today’s increasingly complex and voluminous data sets.
According to legend, King Midas died because everything he touched turned to gold, so he couldn’t eat or drink. With data, the same thing can happen: having tons of data may seem great at first glance (like King Midas’ ability), but if you don’t know what to do with it, it will mislead you or you simply won’t be able to do anything with it. The MIDAS team wants to provide and explain methods that prevent you from ending up with data like King Midas.1
One of the MIDAS team’s key themes is sports analytics. Sports analytics is the collection of relevant historical statistics that can provide a competitive advantage to a team or individual by helping to inform players, coaches and other staff and facilitate decision making during and prior to sporting events.2
Prof. Christophe Ley has published a book on the subject of sports statistics, which deals with the most diverse and fruitful combinations of data analysis and sport, such as a study conducted by the LIH on running shoes that reduce injuries while running, or image recognition techniques for more effective match analysis.
In 2018, Christophe Ley, a professor of statistics at Ghent University (Belgium) at the time, combined statistics and sport for the first time. Together with colleagues, he developed a new method for predicting the winner of the 2018 World Cup.
Unlike traditional methods used by bookmakers that rely primarily on human analysis of betting and performance data, Ley’s approach combines statistics with machine learning to create a more reliable model.
The core of their method is based on the use of the “Random Forest”, a machine-learning algorithm consisting of decision trees that are constantly run through by a computer programme. The decision parameters relating to players, opponents and the environment are defined partly by machines and partly by human beings, and the World Cup is replayed again and again. As each replay is associated with an (automatic) learning process, predictions become increasingly reliable (Hauser, 2018).
Recently, Christophe Ley, accompanied by members of his MIDAS team, visited the facilities of Borussia Dortmund, a German football club, just before their Champions League match against Paris. The visit was part of the Math4Sports project, which brings together several major European football clubs: Arsenal FC, Athletic Bilbao, PSV Eindhoven, Benfica Lisbon and Borussia Dortmund.
The main aim of this collaboration is to use statistics and data analysis to improve injury prevention in football. At a meeting in Dortmund, university researchers and sports scientists discussed how science could help reduce the risk of injury, a recurring problem for BVB in recent seasons.
Statistics are increasingly used in modern sport: players’ movements are tracked during training and matches, generating huge amounts of data that statisticians can analyse to optimise performance and prevent injury.
A concrete example of the usefulness of sports statistics is another collaboration by the MIDAS team with the Doneck Dolphins Trier, a wheelchair basketball team. Ley and his colleagues have developed a method for predicting player performance and proposing optimal team compositions, taking into account the specific rules concerning handicap points in this sport (Bertemes, 2024).
1 Description taken from the MIDAS web page.
2 https://en.wikipedia.org/wiki/Sports_analytics
LUCET (Luxembourg Centre for Educational Testing) at the University of Luxembourg is an educational research group whose main mission is to implement, improve and ensure school monitoring in Luxembourg, an activity that mobilises the majority of its resources.
Founded jointly by the University of Luxembourg and the Ministry of Education in July 2014, this unique research and transfer centre is the culmination of the “Standardised Tests” (ÉpStan) project. This long-term research programme (2007-2014), funded by the Luxembourg Ministry of Education, was already devoted to school monitoring and analysis of the country’s educational challenges.
Given the importance of the issues identified, the 2014-2017 Pluriannual Establishment Contract between the State and the University officially integrated this programme into the university structure, creating a research centre attached to the Faculty.
Standardised tests (EpStan) are currently used as school monitoring tools in Luxembourg and consist of tests and questionnaires presented in pencil and paper versions, and/or on computer. These tests provide a standardised assessment of skills in key areas of school education or key aspects of the quality of teaching, the school and classroom climate and pupils’ motivation to learn. More specifically, once a year, at the start of the new compulsory schooling learning cycle, i.e. cycles 2.1, 3.1, 4.1 and 7eand 5eof the ESC/ESG, EpStan enables all pupils at the corresponding levels of study to be assessed as to whether the learning objectives of the previous learning cycle have been achieved. Every year, all the pupils in each class concerned take part in EpStan. This represents around 28,000 pupils per year. To ensure a fair comparison of performance, EpStan systematically takes account of pupils’ socio-economic and socio-cultural background, and thus of characteristics that have been shown to have a major influence on school success on average.
Luxembourg faces a major educational challenge: managing an increasingly diverse pupil population effectively. According to the OECD’s PISA studies, this challenge is not unique to the country but is particularly pronounced due to specific factors such as its small size, its central position in Europe, its multilingualism and its economy based on immigration.
This situation makes Luxembourg a veritable “living laboratory”, where demographic changes occur more rapidly than elsewhere. The solutions developed in Luxembourg to offer equal opportunities for success to all pupils, regardless of their socio-economic, cultural or linguistic background, could therefore serve as a model for other countries facing similar challenges in the decades to come.
It is in this context that Standardised Tests (EpStan) play a crucial role. These evaluations provide relevant data that make a major contribution to educational management and empirical research in the field of training. They make it possible to objectively evaluate the performance, equity and evolution of the Luxembourg school system over the long term, thus providing a solid scientific basis for responding to the challenges of diversity.
While assessments for all elementary schools are paper-based, EpStan assessments for secondary schools are fully computerised and web-based (using OASYS, LUCET’s in-house online assessment system).
Thanks to Luxembourg’s school tracking programme, LUCET not only provides timely and relevant information to national education stakeholders but also constitutes a unique and incredibly rich longitudinal database on the evolution of pupils’ skills profiles, their school career and, eventually, their life course.
References
1. Andrews, R. 2021. The radiant diagrams of Florence Nightingale Michael Friendly.
2. Bertemes, J-P. 2024. BVB: Wird ein luxemburgischer Forscher Borussia Dortmund in Zukunft helfen? Science.lu. https://science.lu/fr/node/16698
3. Bostridge, M. 2008. Florence Nightingale. London: Penguin Books.
4. Bradshaw, NA. 2017. Florence Nightingale (1820–1910): A Pioneer of Data Visualisation. In: Beery, J., Greenwald, S., Jensen-Vallin, J., Mast, M. (eds) Women in Mathematics. Association for Women in Mathematics Series, vol 10. Springer, Cham. https://doi.org/10.1007/978-3-319-66694-5_11
5. Hauser, S. 2018. Luxemburger Forscher weiß (ziemlich sicher), wer Fußball-Weltmeister wird. Science.lu. https://science.lu/fr/treffsichere-prognose/luxemburger-forscher-weiss-ziemlich-sicher-wer-fussball-weltmeister-wird
6. Luxembourg Centre for Educational Testing (LUCET), https://www.uni.lu/fhse-en/research-groups/luxembourg-centre-for-educational-testing-lucet/
7. Vogt A., Osipenko M. What is statistics? – From a historical perspective (SE). https://www.wiwi.hu-berlin.de/de/forschung/irtg/lvb/statistik/Teaching_Moodle/ss13/hist
8. Wikipedia. Down Survey. https://en.wikipedia.org/wiki/Down_Survey
