Warning: It's not enough to give the final result (e.g. 'people who own an iOS device also own more TVs at home'), but you need to add an explanation (e.g. 'because on average, people who own an iOS device own 2.3 TVs, whereas the others only own 1.8').
4.2 Lesson planning
Ce module a été réalisé en collaboration avec Prof. Khoi Mai Huy de l’Université du Québec en Abitibi-Témiscamingue. Cette collaboration a été financée en partie par le projet ERA Chair in Mathematical Statistics and Data Science – SanDAL du Département de Mathématiques de l’Université du Luxembourg.
This module was produced in collaboration with Prof. Khoi Mai Huy from the Université du Québec en Abitibi-Témiscamingue. This collaboration was partly funded by the ERA Chair in Mathematical Statistics and Data Science – SanDAL project of the Mathematics Department of the University of Luxembourg.
01
Conditions of unit
Target audience : 6e
Place : a typical classroom
Materials required: : at least one computer or tablet with internet access per group of 2 pupils.
Duration : 3-4 times 45 minutes
02
Targeted skills
Skills targeted by the mathematics course
Contents
- Choose a chart type
- Graphical interpretation
- Create a survey
- Interpreting survey results
The student is able to
- construct a table of values, an evolving graph/diagram, a bar graph/diagram, a circular graph/diagram
- choose the appropriate graph/diagram to represent data
- conduct a survey using digital tools
- use a spreadsheet to analyse data and visualise it using a graph
03
Over the course of the lesson
Lesson One
Introduction (5 min). The pupils watch the short, interesting Youtube video adapted to their level:
Discussion (10 minutes). The key elements of the video (asking questions, selecting people who represent the population, sample, observing public opinion etc.) are discussed in plenary.
Create your own survey (30 min).
Students set up their own survey. They choose a target population (pupils in the class, at school, friends, the whole population of their village, country, etc.). They then formulate (at least) 6 questions aimed at finding out what their target population thinks about a given topic. For each question, they must think about whether it’s a
- multiple choice,
- open response,
- opinion
- …
They also have to think about any possible answers (M1). Students then create a survey in Microsoft Forms. Any other software is also permitted. We opted for Microsoft Forms because students and teachers have access to it via Microsoft 365 Copilot (formerly Office 365). There are three options:
- Students can conduct their own surveys.
- They can use a survey made by us:
- They can adapt the survey we did.
Technical explanations of the survey are given in M2.
Homework. Finish creating the survey and get friends, schoolmates, family, etc. to fill it in.
Second lesson
Introduction (5 min). The students are given 5 minutes to contemplate the data they have collected.
Data analysis (10 min). Discuss in plenary the data collected by the students: does all the data correspond to the expectations of the question? Could or should the questions have been asked differently? Should the possible answers have been formulated differently?
Differentiation. for advanced students, a discussion on possible outliers can take place, as well as a reflection on what to do with this data.
Correcting the survey (5 min). The students go back to table M1 (M3) and reformulate the questions in their survey.
Research question (15min). Divide the class into teams of 3 or 4 pupils. We recommend favouring teams that work well together and not multi-level: weak together and strong together1. This encourages discussion. Each team thinks about an interesting statistical research question that meets the following conditions:
- impossible to answer yes/no,
- obligation to combine two survey questions,
- interesting question for the students.
Here are a few examples based on our survey:
- Who spends more time in front of the screen, girls or boys?
- Do those with an iOS device spend more time in front of the screen, or do others spend more time in front of the screen?
- What is the link between a person’s age and their main activity on their smartphone?
- Do people with IOS, Android or Windows smartphones have more TVs at home?
Research question 2 (10 min). Pool (in a google doc) all the possible statistical research questions and choose one of them (discussion + vote). The discussion can focus on (among other things)
- interest,
- relevance,
- formulation (clarity).
Voting may be anonymous or by a show of hands.
Third lesson
Introduction (5 min). Repetition of the research question chosen by vote in the previous lesson.
Result (15 min). Resolution of the issue within the team.
Instructions for students :
- Watch out for outliers (see above).
- Find an answer to the question using the data.
- Make a graph.
Instructions for teachers :
- walk around and see what the students are doing
- signal to a team if they do not consider outliers, work with inadequate data, etc.
Formulation of results (15 min). The students formulate an answer to their research question by making a graph and writing a short text. Students can use the graph generated automatically by Microsoft Forms. They can also export the answers to Excel (see M3) and then create a custom graph. Any other program or spreadsheet can also be used.
Presentations I (10 min). Each team presents its results on the board (choice: spokesperson or all together), with their graph in support. They are also asked to present their analysis method.
The other pupils can react to the results of the other teams and ask questions. The teacher comments on the graph (colours used? Axis labels? Titles? Clear?).
Fourth lesson
Presentation II (10 min). Finish the presentations started in lesson three.
Wrap up (15 min). During the plenary session, the teacher guides the pupils through a comparative analysis of the different strategies employed by each group. The teacher explicitly emphasises that different answers may all be valid in this context.
The teacher points out that each method has its own strengths and weaknesses. He points out that this module is distinguished by the absence of a single, definitive solution.
If time allows, the teacher can orchestrate a metacognitive discussion to get the students to think about this particularity of statistics: why does it accept several correct answers, unlike the mathematics they usually practise at school? This reflection will enable them to deepen their epistemological understanding of the disciplines and develop their critical thinking when faced with different forms of scientific reasoning.
1 Some recent research in mathematics didactics has shown that in mixed or multi-level groups, stronger students tend to dominate team discussions and make important decisions about the mathematics to be worked on, while weaker students are more involved in more procedural tasks (taking notes, etc.).
04
Differentiation possibilities
The teacher will note that this unit allows for natural differentiation adapted to the different levels of students. For the more advanced learners, it is advisable to encourage them to deepen their statistical thinking by exploring more complex concepts such as the identification and treatment of outliers. The teacher can guide them in questioning the impact of these values on their results, the appropriate methods for detecting them and the different strategies for dealing with them (inclusion, exclusion, data transformation).
The intrinsic flexibility of this module is one of its main pedagogical assets. By allowing students to design their own survey and formulate their research questions according to their abilities and interests, the module naturally adapts to the different skill levels present in the classroom.
- This open structure offers several advantages:
- Students who need more support can work on more accessible issues.
- More advanced students can engage in more sophisticated statistical analysis.
- Each group can progress at its own pace while participating in the same overall project.
- The teacher can differentiate his or her support according to the specific needs identified.
This automatic differentiation built into the very design of the activity enables the teacher to create an inclusive learning environment where each student is stimulated to his or her optimum level of development.
05
Further criteria to be met as part of the lesson series
- Luxembourg context: The MIDAS team at the University of Luxembourg, led by Prof. Christophe Ley, conducts research into modelling, data science, applied mathematics and statistics. Among other things, they carry out interdisciplinary projects on statistics and sport.
- Differentiation: As described in the previous paragraph, the module contains several levels of differentiation, both in the choice of version of the survey (new survey, adaption or copy) as well as in the choice of the research question chosen.
- Reference guide for media literacy1 :
Competence 1: 1.1 Filtering and researching data, information and digital content, 1.2 Analysing and assessing data, information and digital content, 1.4 Processing data, information and digital content.
Competence 2: 2.1 Working with others, 2.2 Sharing and publishing data, information and digital content
Competence 3: 3.3 Modelling, structuring and coding - 4C model: communication, collaboration, creativity, critical thinking: The 4Cs are used in this module. The various questions are solved in groups, which requires communication and collaboration on the part of the students. The main idea behind this module on data and statistics is to develop critical thinking skills.
- Link to mathematical research: Data science represents one of the fastest-growing areas where mathematics is being applied to solve modern problems, from predicting disease outbreaks to improving social media algorithms.
1 https://edumedia.lu/wp-content/uploads/2024/12/Medienkompass_EN_web.pdf
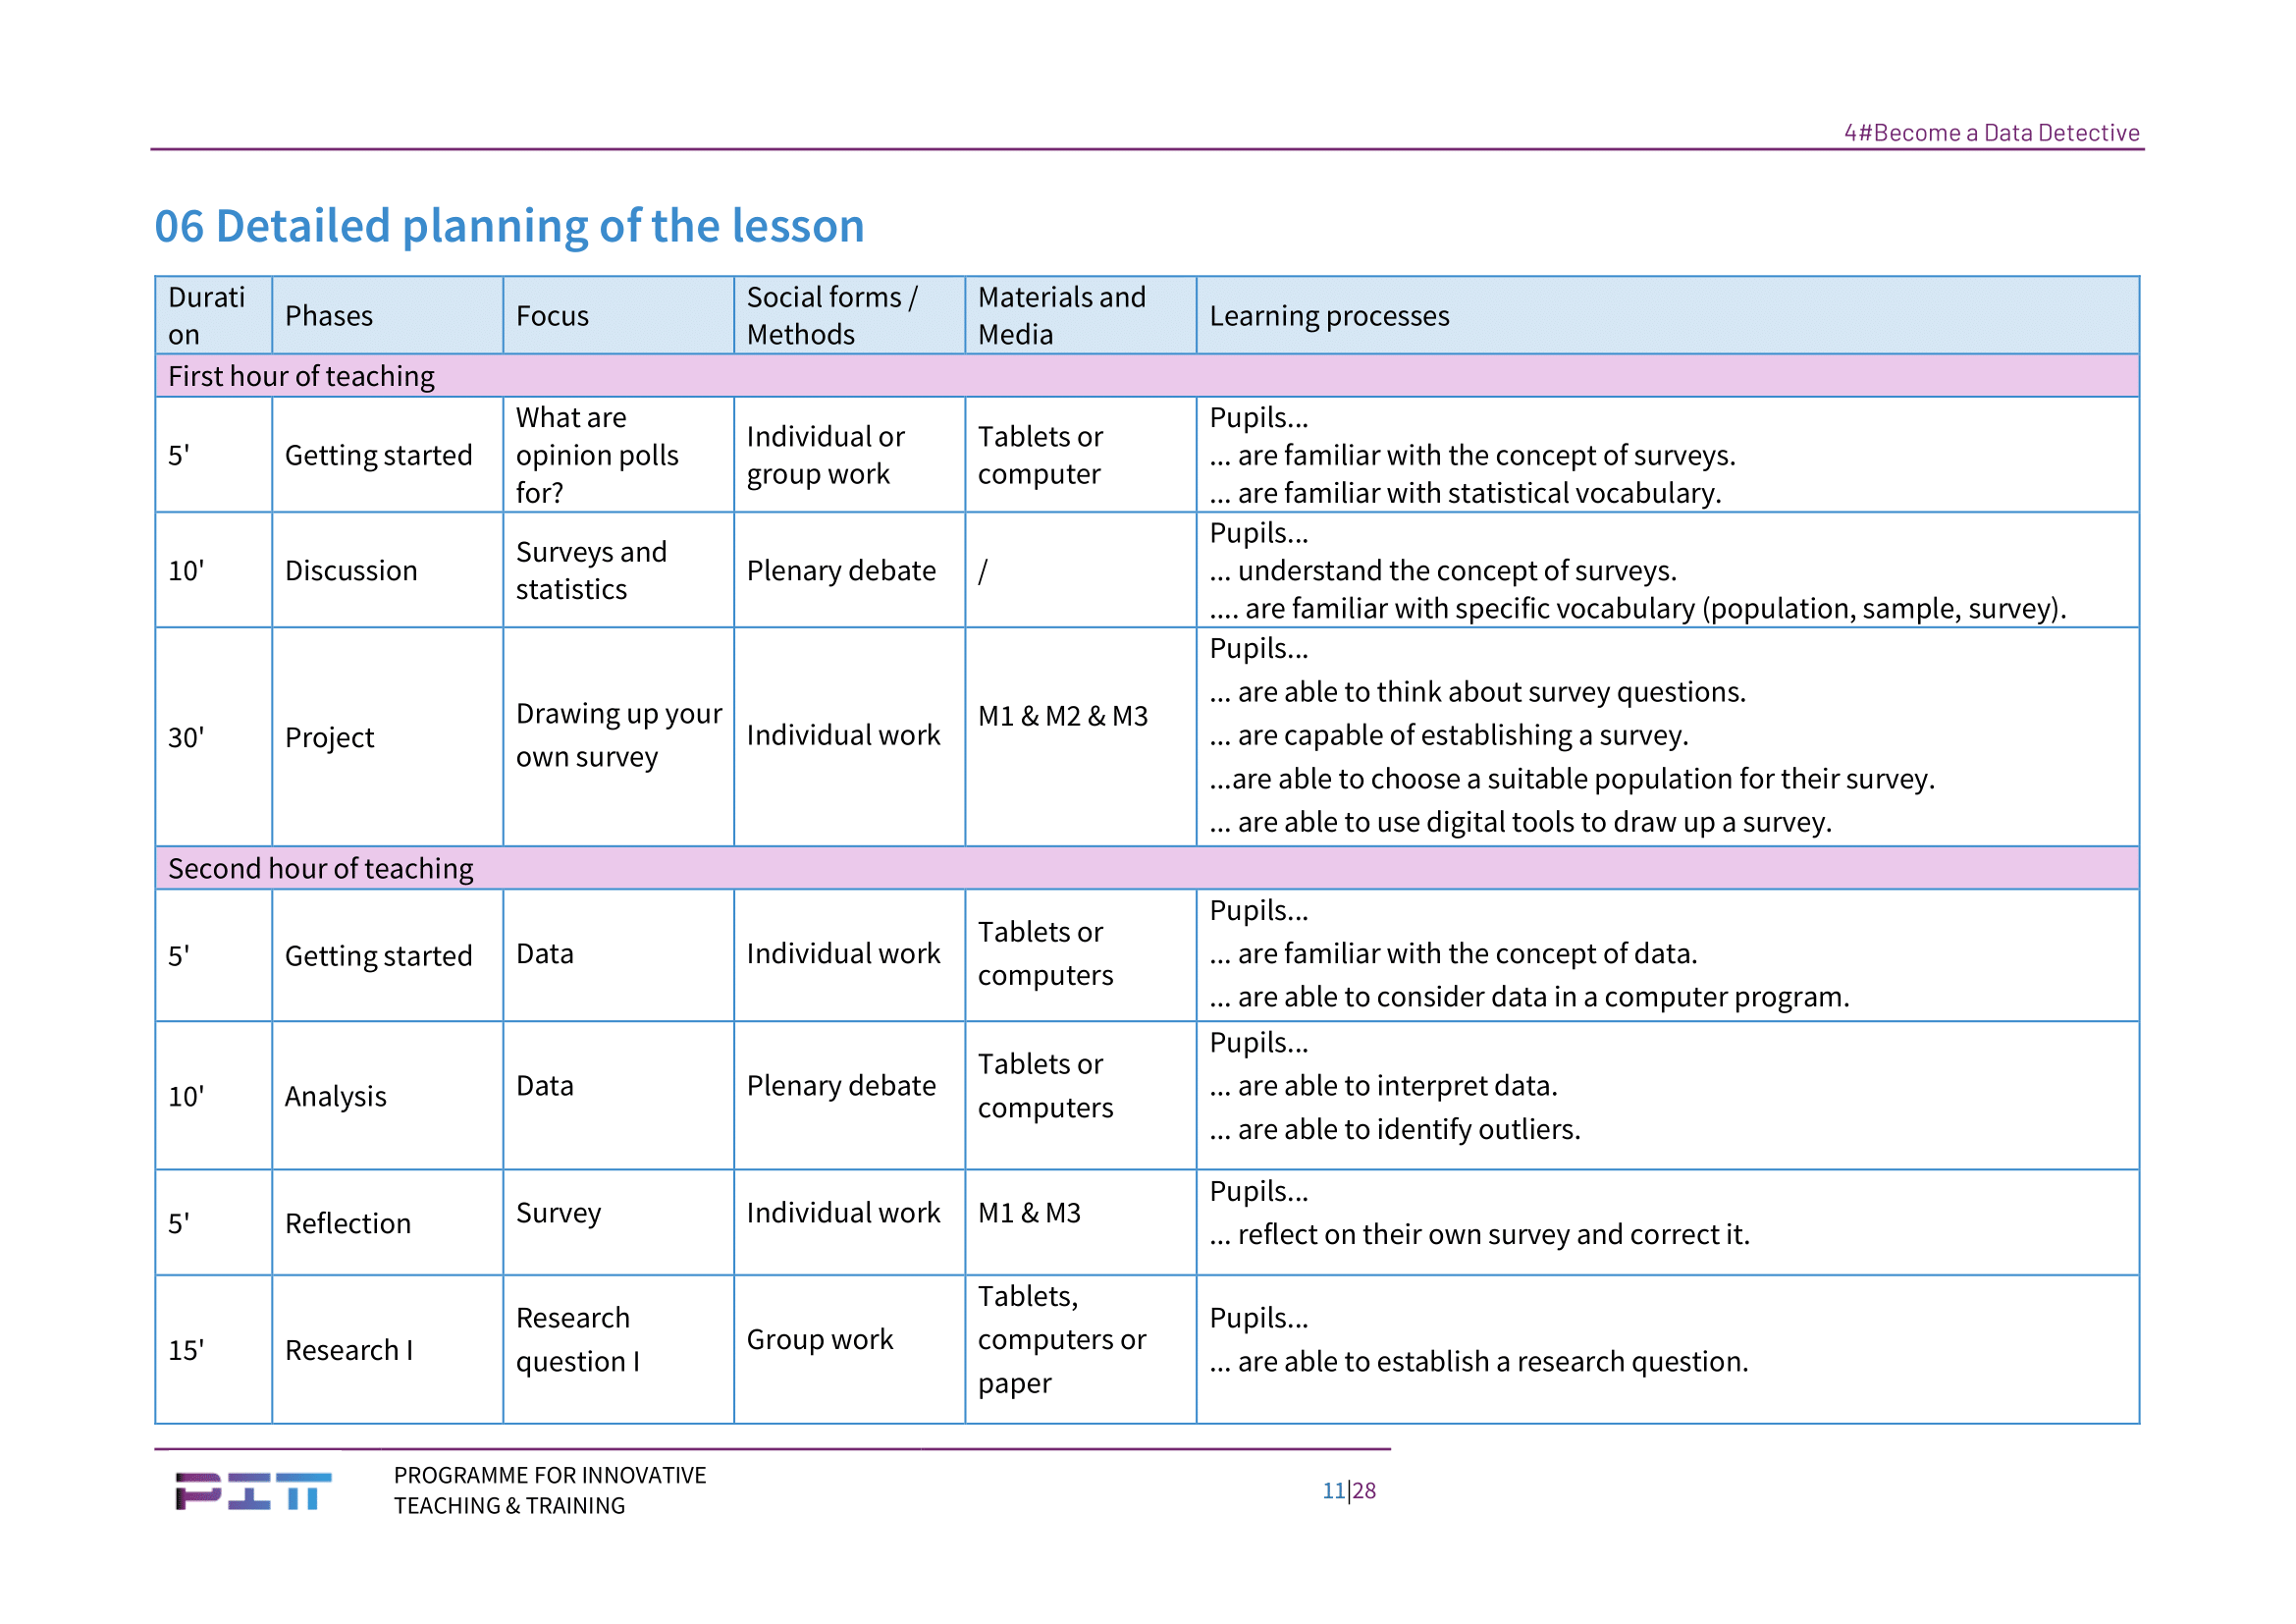
06
Detailed planning of the lesson