Data Viz Superpowers
3#Data Viz Superpowers

3.3 Teaching materials
Exercise 1
→ Look at the Instagram post below. What data do you see?
Try to find as many as possible.

Cristiano Ronaldo’s first steps out in the Manchester United shirt received 19.3 million likes.
Exercise 2
We have just seen that pretty much everything we see around us can be a form of data. Now let’s try to classify the data we saw in the image above.
First of all, we can distinguish between quantitative data and categorical data. Quantitative data are expressed in numbers. Categorical data are data which cannot be measured or expressed using numbers. These data are classified according to different types.
Within quantitative data, we can distinguish discrete data which can only represent certain distinct values. For example, the number of people on the photo is a kind of discrete data, because there can only be 1, 2, 3 or more people (but not one and a half people).
→ Now it’s your turn: look at all the data you have collected – which of them are discrete?
If quantitative data are not discrete, then they must be continuous. This means that they can take on any possible value between two figures. For example, Cristiano Ronaldo’s height is a form of continuous data, because Ronaldo could be 1.87 metres tall, or 1.88 m, or even 1.875 m.
→ Now it’s your turn: look at all the data you have collected – which of them are discrete?
The categorical data relate to what we see in different groups: on the photo, there are people wearing football shirts, or yellow safety vests, and other people wearing normal clothes.
→ Now it’s your turn: look at all the data you have collected – which of these are categorical?
Categorical data which can be ‘ordered’, i.e. we are able to put into an order, are called ordinal data. The comment from miralem_pjanic is the first comment, while the one from raulgonzalez is the second. This means these are ordinal data.
When categorical data cannot be put into an order, we call them nominal data. The colour of the clothes of people on the photograph is a type of nominal data.
→ Did you find any other ordinal or nominal data?
Exercise 3
→ Have a go!
Look at the following tweet from Science.lu and collect the data. Classify the data you have found according to the criteria you saw in the previous exercise.

Übung 4
Once we have collected our data, we can organise them in a table. In every table, we collect the data on a topic which interests us, so that every line contains information on the same topic. And in every column, we collect data on a specific characteristic.
Let’s look at an example!
→ Let’s have a look at the five football players with the most followers on Instagram and compare their club, their age, nationality and their favourite food. Fill in the table.
Every line represents a person or an object, while every column represents a characteristic.
| Player | Club | Year of birth | Nationality | Favourite dish |
|---|---|---|---|---|
| Al Nassr | 1985 | Bacalhau à Brás | ||
| Lionel Messi | PSG | Argentinian | ||
| Neymar Jr. | 1992 | Italian and Japanese | ||
| PSG | 1998 | |||
| 1981 | Falukorv |
Exercise 5
→ Now it’s your turn. Move around the classroom and collect data about your classmates. Make a table with one line per pupil (and maybe include your teacher too, if you want!), where every column corresponds to a characteristic. Select 5 different characteristics of your choice – be creative!
Tables are very helpful for organising data, but if we want to find out one particular thing, then this can be a bit tricky. By transforming the information into data visualization, i.e. a visual representation of the data, we gain some superpowers: visualizations can “help make the invisible visible”. We are able to take in more information through our vision than with all the other senses combined. Let’s look more closely at some of these superpowers.
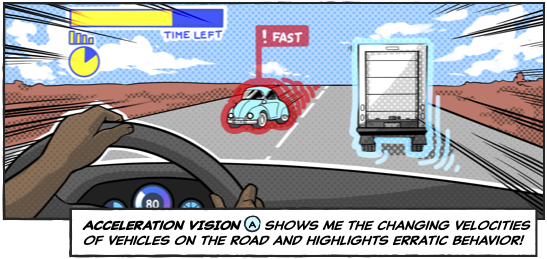
The “enhanced attention” superpower
Source : Perception ! Immersion ! Empowerment ! Superpowers as Inspiration for Visualization https://arxiv.org/pdf/2108.03524.pdf
By boosting their ability to pay attention, superheroes can very quickly become aware of important information or visual details in their environment.
For normal human beings, this extra information would just go unnoticed.
Exercise 6
→ How many 5’s can you see?

→ Just by looking it is not very easy to see the 5’s. Click on the “Colour” button and count 5 again.
By using a visual tool (such as colour), we can quickly see whatever we are interested in. A superpower that’s easy to learn!
Exercise 7
a) Who has the most followers on Instagram?
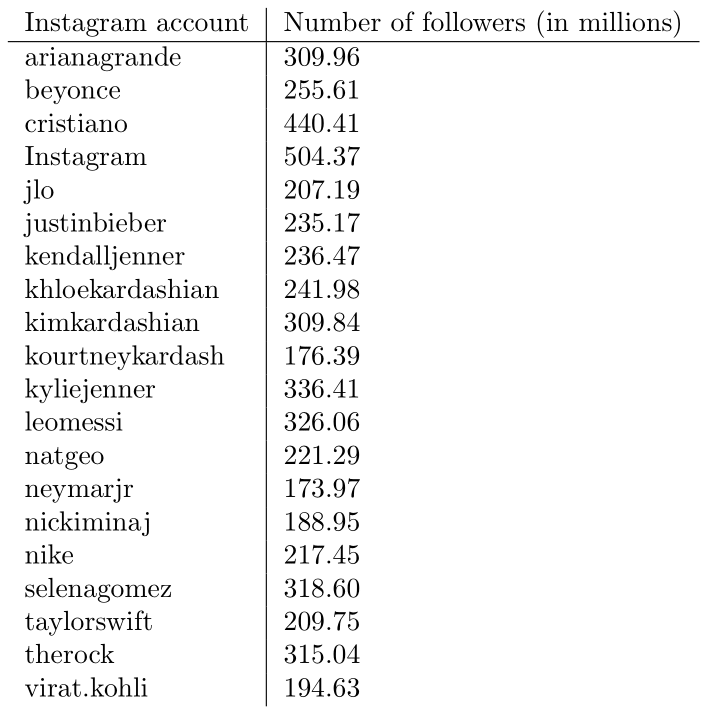
Examine the table carefully. You can see that some accounts have more than 500,000 followers, while others have more than 400,000, and others more than 300,000, etc.
→ Click on the “Colour” button.
One colour is used to highlight the accounts with over 100,000 followers, while a second colour highlights accounts with more than 200,000 followers, and so on. Now you can see more easily who has lots of followers and who does not have very many.
b) Look at the following statistics:
https://www.statista.com/statistics/421169/most-followers-instagram/
→ Compare it with the previous tables. What differences do you see?
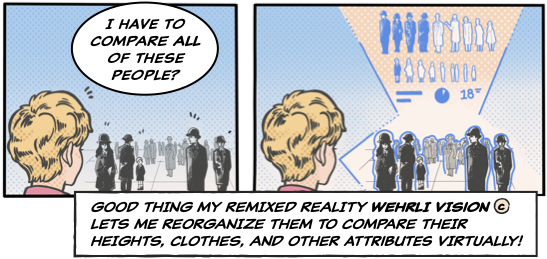
The “enhanced comparison” superpower
Source : Perception ! Immersion ! Empowerment ! Superpowers as Inspiration for Visualization https://arxiv.org/pdf/2108.03524.pdf
Exercise 8
Superheroes also have an “enhanced comparison” superpower which enables them to quickly and precisely identify the differences and similarities between different phenomena.
Thanks to data viz, you can do it too!
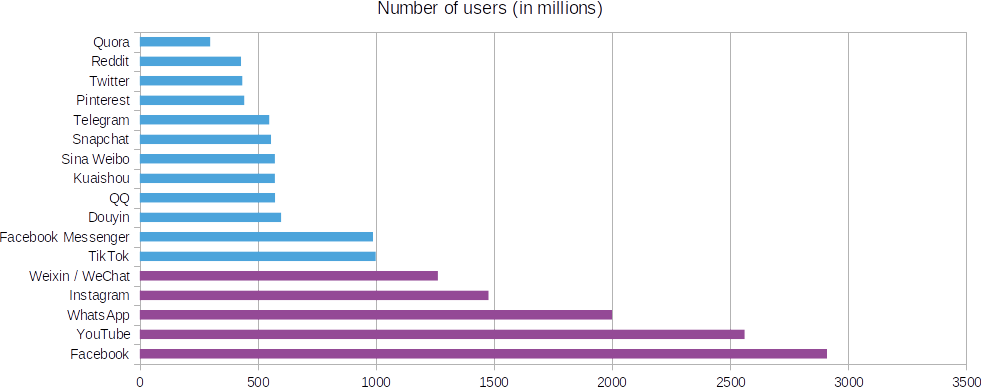
→ Which social media have more than 1 billion users?
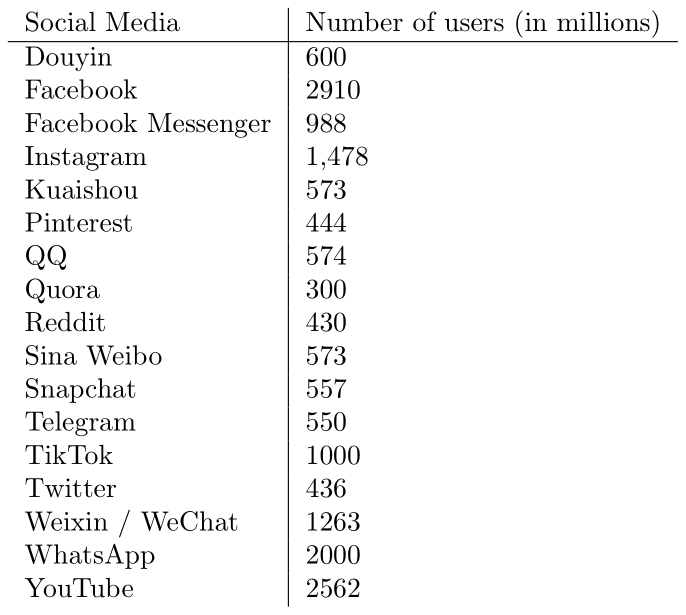
If you transfer the figures into a bar chart, you will be able to answer the question much more easily.
Exercise 9
In which countries are social media networks blocked? Below you can find a file with all the information about all the countries and a graph.
Social Media Censorchip Tracker
And now here’s a graph:
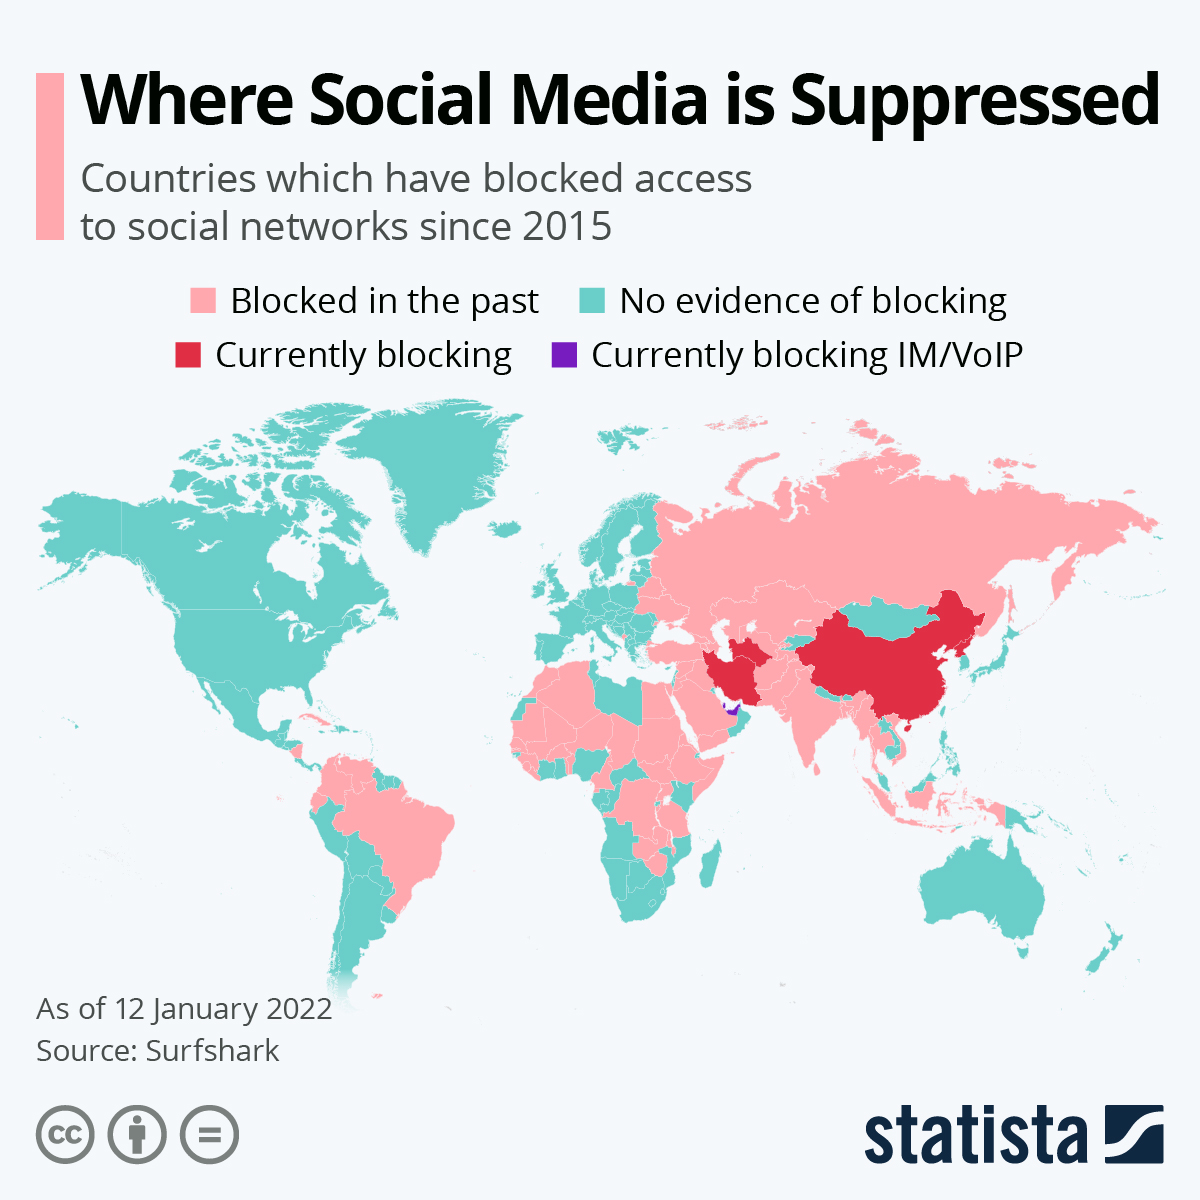
Source: https://www.statista.com/chart/23804/countries-blocking-social-media/
→ Which tool helps you find the answer the fastest?
The “enhanced prediction” superpower

Source : Perception ! Immersion ! Empowerment ! Superpowers as Inspiration for Visualization https://arxiv.org/pdf/2108.03524.pdf
Prediction gives you the ability to see into the future.
Exercise 10
→ This graph predicts how many smartphones there will be in the world from 2023 to 2027.
Can you predict how many there will be in 2028?

Source : https://www.statista.com/statistics/330695/number-of-smartphone-users-worldwide/
The “enhanced memory” superpower
Source : Perception ! Immersion ! Empowerment ! Superpowers as Inspiration for Visualization https://arxiv.org/pdf/2108.03524.pdf
Exercise 11
Dataviz superheroes also have better memories which allow them to quickly and accurately recall things they have observed in the past. This skill helps them quickly identify different phenomena or make links between past experiences and new observations or information. For this, we use data storytelling.
→ Look at the following image which uses data to tell you a story. Here you can see photos published in newspapers which were awarded with the “World Press Photo” prize. Write the story that it tells in your own words.
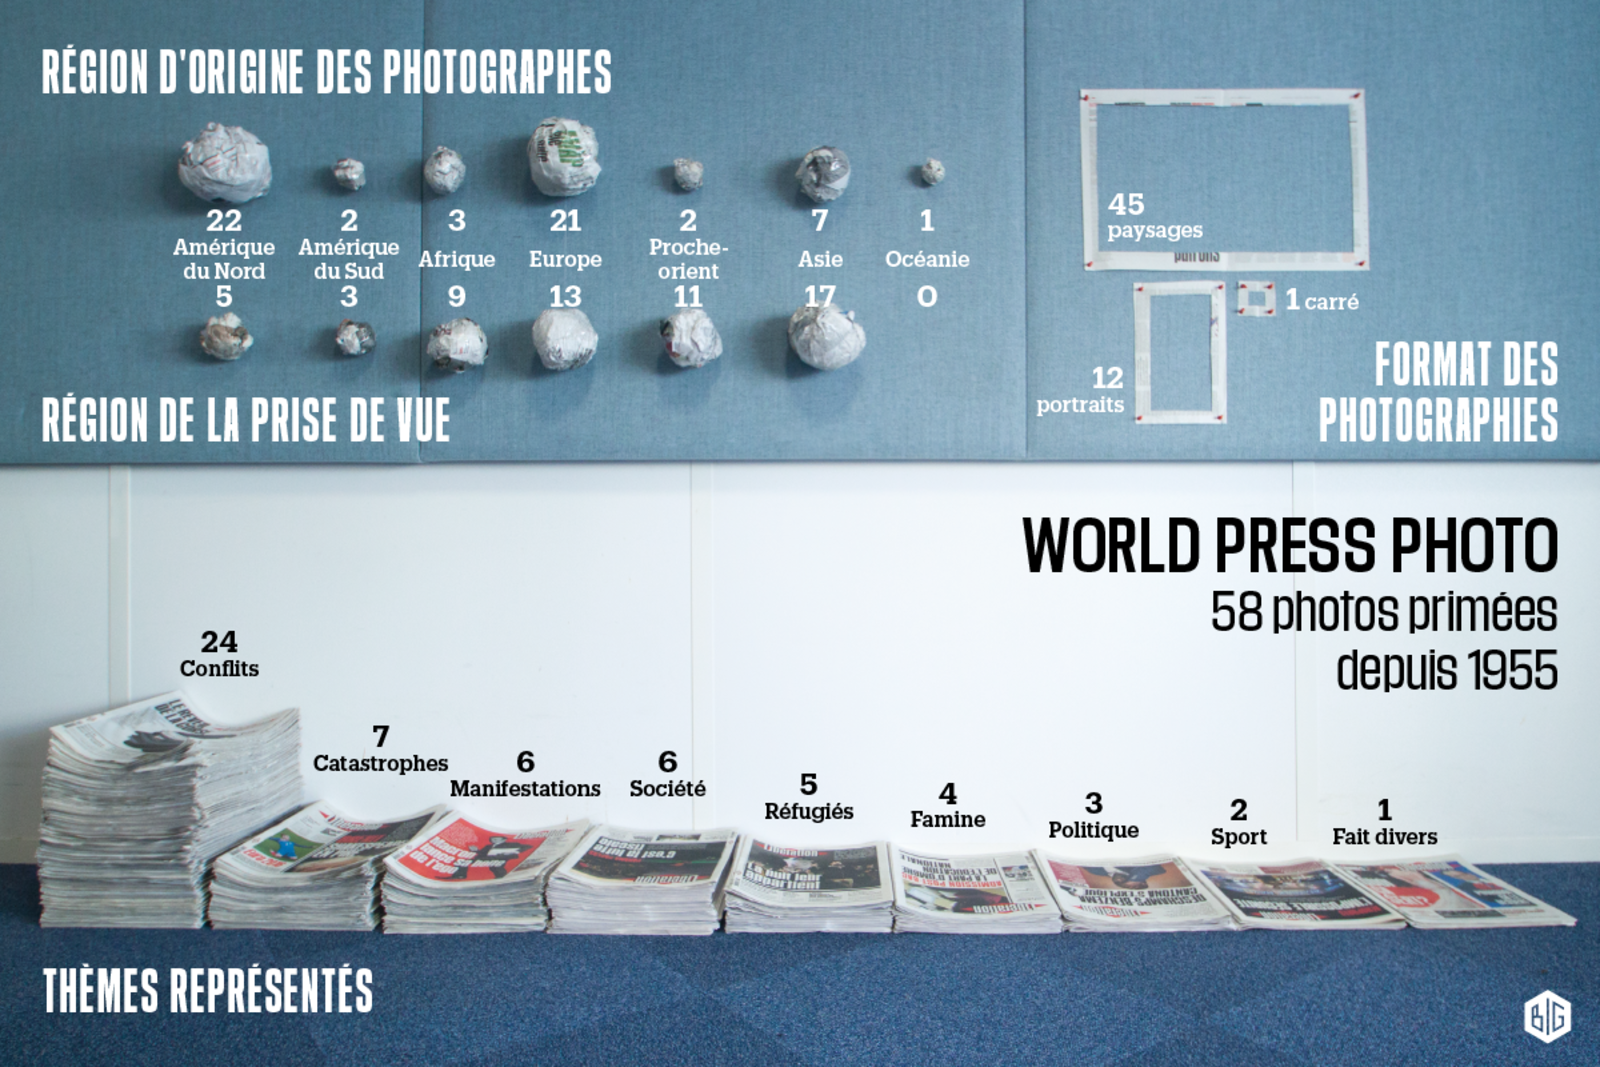
Source: http://claradealberto.com/portfolio/infographies-en-photos/
You have to watch out! Sometimes, superheroes transform into supervillains and use dataviz to lie to us and make us believe something that’s untrue.
Exercise 12
On the following graph, we can see that Charli d’Amelio and Khabane Lame have twice as many followers as the other stars on TikTok.
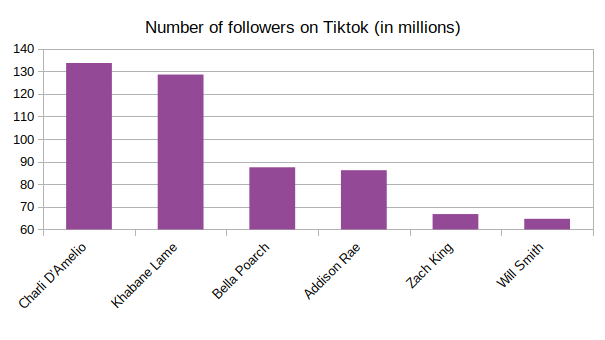
→ Is this statement correct? Explain and justify your answer.
Exercise 13
On the following graph, we can see that the number of subscriptions to Netflix has not increased substantially over the last 20 years.
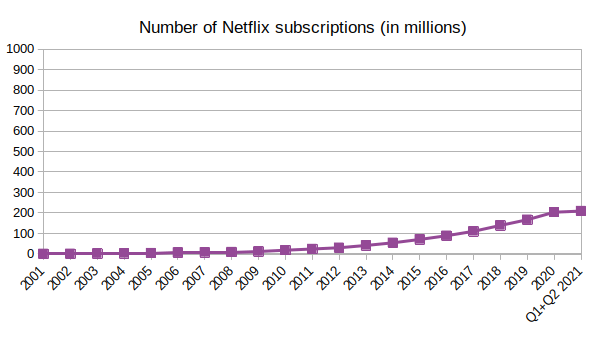
→ Is this statement correct? Explain and justify your answer.
Exercise 14
More and more people in Luxembourg are wanting to leave WhatsApp and join the Signal messaging service instead. The following graph clearly shows this:
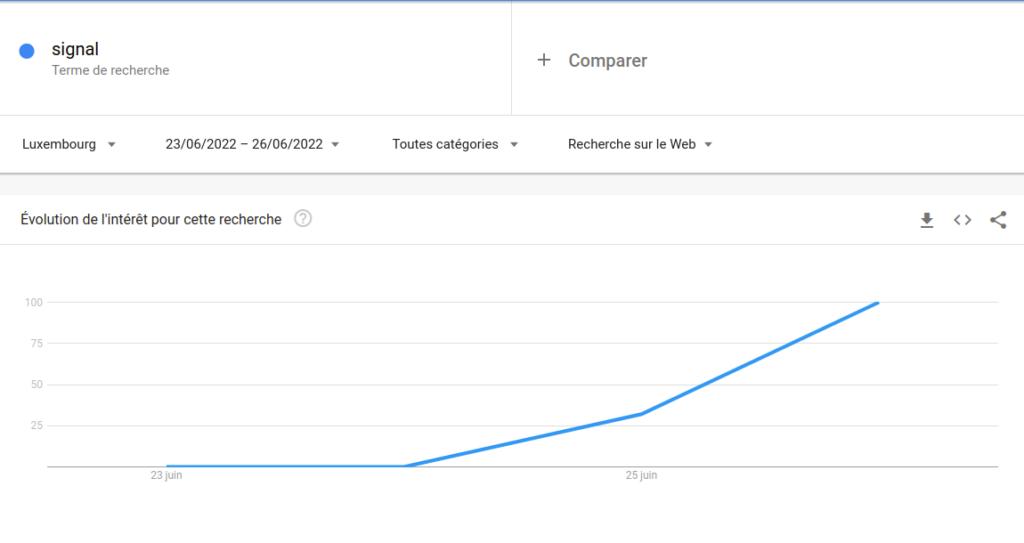
→ Look carefully at the graph. Is the statement above really correct? Justify your answer.
Exercise 15
What social media networks are most popular in Luxembourg? Here are two graphs.
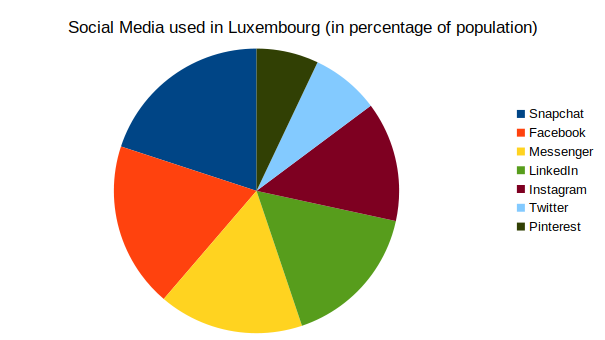
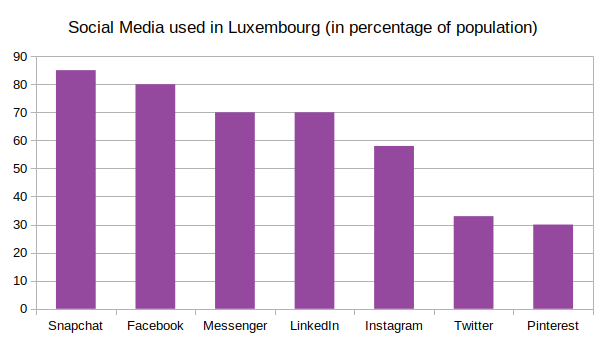
Source: https://www.lessentiel.lu/fr/story/snapchat-reseau-social-numero-1-au-luxembourg-461764963963
→ In your opinion, which of these two graphs is better for comparing the number of users of different social networks?
Exercise 16
Here is a visualization made by researcher Aida Horaniet Ibañez from the University of Luxembourg. Working in groups, explore this visualization (using your mouse or finger) and note down all the information you can find. Then discuss and compare what you found.
https://public.tableau.com/app/profile/aida3847/viz/test_15897460999620/Dashboard4
