Data Viz Superpowers
3#Data Viz Superpowers

3.5 Evaluation ideas
In the context of the #Data Viz Superpowers module, three tasks for evaluation are suggested here for different levels of difficulty. They can be used and combined depending on what is needed. The tasks should be completed at home, because they require pupils to observe data over a week.
If this evaluation has to be completed in class, pupils can also observe data for a shorter amount of time and complete the classification, tables, and graphic representation in class during the following lesson.
An additional project can also be organised in collaboration with the pupils’ art classes. It is up to the teacher to decide whether to include this in the evaluation.
These tasks, in particular the artistic component, have been inspired by Giorgia Lupi and Stefanie Posavec’s Dear Data project. Over the course of one year, every week Giorgia and Stefanie collected and measured a certain type of data from their personal lives. Then they created an artistic visualization of the data they had collected in the form of postcards which they sent to each other (Davis, 2016). If the pupils complete this project, they can contact the designers and send their work to them. This is explained at the bottom of the page of the Dear Data project.
Level of difficulty: basic
Up to now we have seen a number of examples of data visualizations based on statistics. These have given us superpowers so we can read faster, find what we need, compare data, or find rare values. Now, it’s the pupils’ turn to play and combine everything together.
First, the pupils have to choose a theme. For example: “music that I hear”. Then, over the course of one week, they collect all the data related to this theme. They should document every piece of music they hear, either by choice or by accident (in a shop, public transportation, etc.), with the option to set an upper limit if there are too many pieces of music. Then, the pupils have to:
- classify the data (determine if they are discrete, continuous, ordinal, or nominal, etc.),
- put the data into a table,
- choose one superpower and make a representation of the data using this superpower.
Level of difficulty: medium
Up to now we have seen a number of examples of data visualizations based on statistics. These have given us superpowers so we can read faster, find what we need, compare data, or find rare values. Now, it’s the pupils’ turn to play and combine everything together.
First, the pupils have to choose a theme. For example: “music that I hear”. Then, over the course of one week, they collect all the data related to this theme. They should document every piece of music they hear, either by choice or by accident (in a shop, public transportation, etc.), with the option to set an upper limit if there are too many pieces of music. Then, the pupils have to:
- classify the data (determine if they are discrete, continuous, ordinal, or nominal, etc.),
- put the data into a table,
- choose one superpower and make a representation of the data using this superpower,
- create a ‘trick’ graph based on the data, by using one of the 4 strategies that we studied for deceiving people.
Level of difficulty: advanced
Up to now we have seen a number of examples of data visualizations based on statistics. These have given us superpowers so we can read faster, find what we need, compare data, or find rare values. Now, it’s the pupils’ turn to play and combine everything together.
First, the pupils have to choose a theme. For example: “music that I hear”. Then, over the course of one week, they collect all the data related to this theme. They should document every piece of music they hear, either by choice or by accident (in a shop, public transportation, etc.), with the option to set an upper limit if there are too many pieces of music. Then, the pupils have to:
- classify the data (determine if they are discrete, continuous, ordinal, or nominal, etc.),
- put the data into a table,
- make a representation of the data for every superpower using each of the superpowers,
- create multiple ‘trick’ graphs based on the data, by using one of the 4 strategies that we have studied for deceiving people.
Artistic component
There are other ways to visualise data by using our own visual vocabulary. Let’s take a look at two examples of visualizations made by the designers Giorgia Lupi and Stefanie Posavec: over the course of one week, they kept track of their activity on their smartphones and used this to make a visualization.
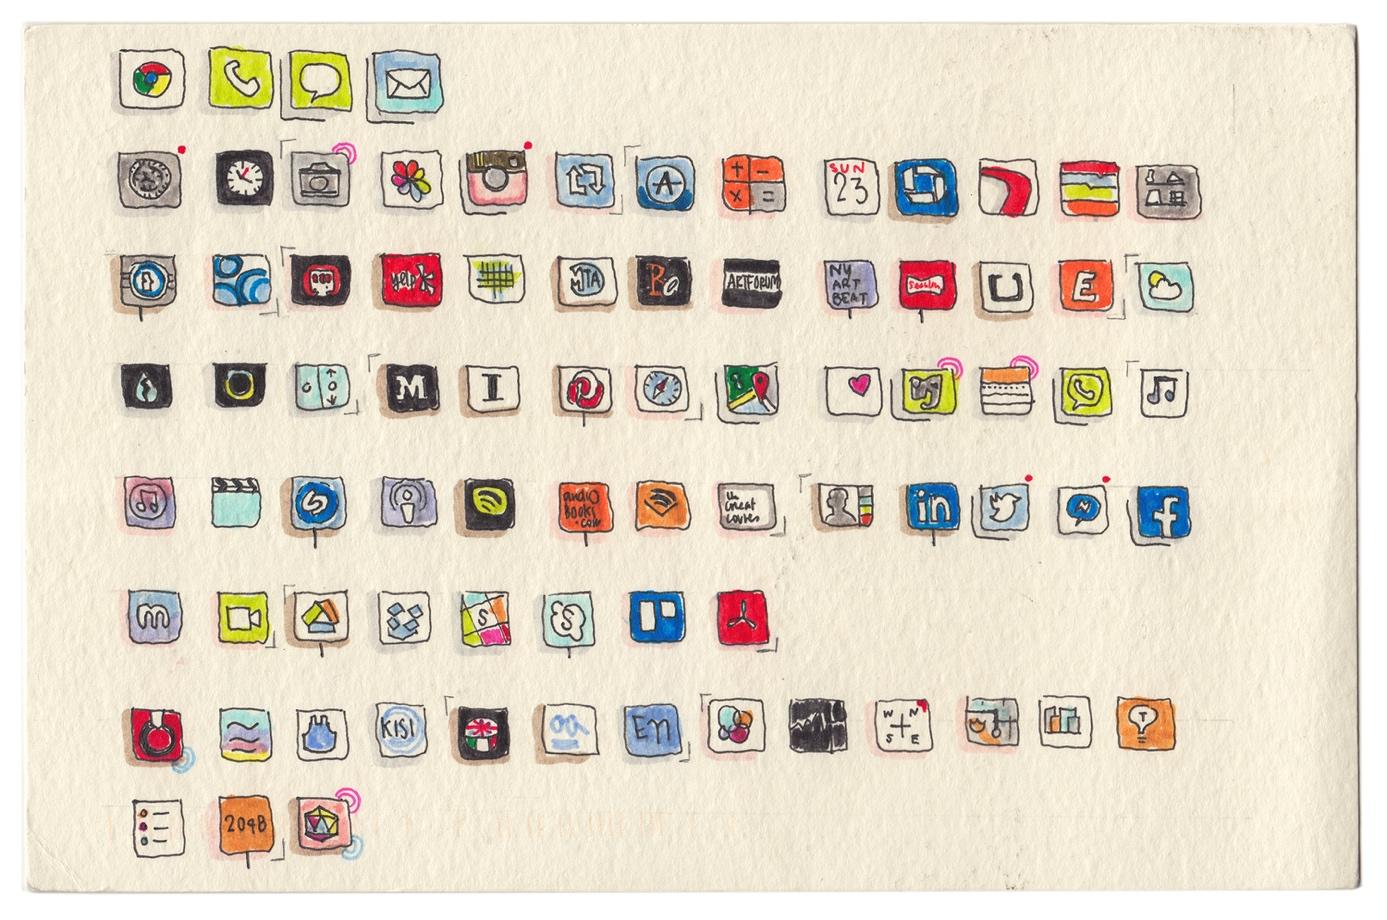
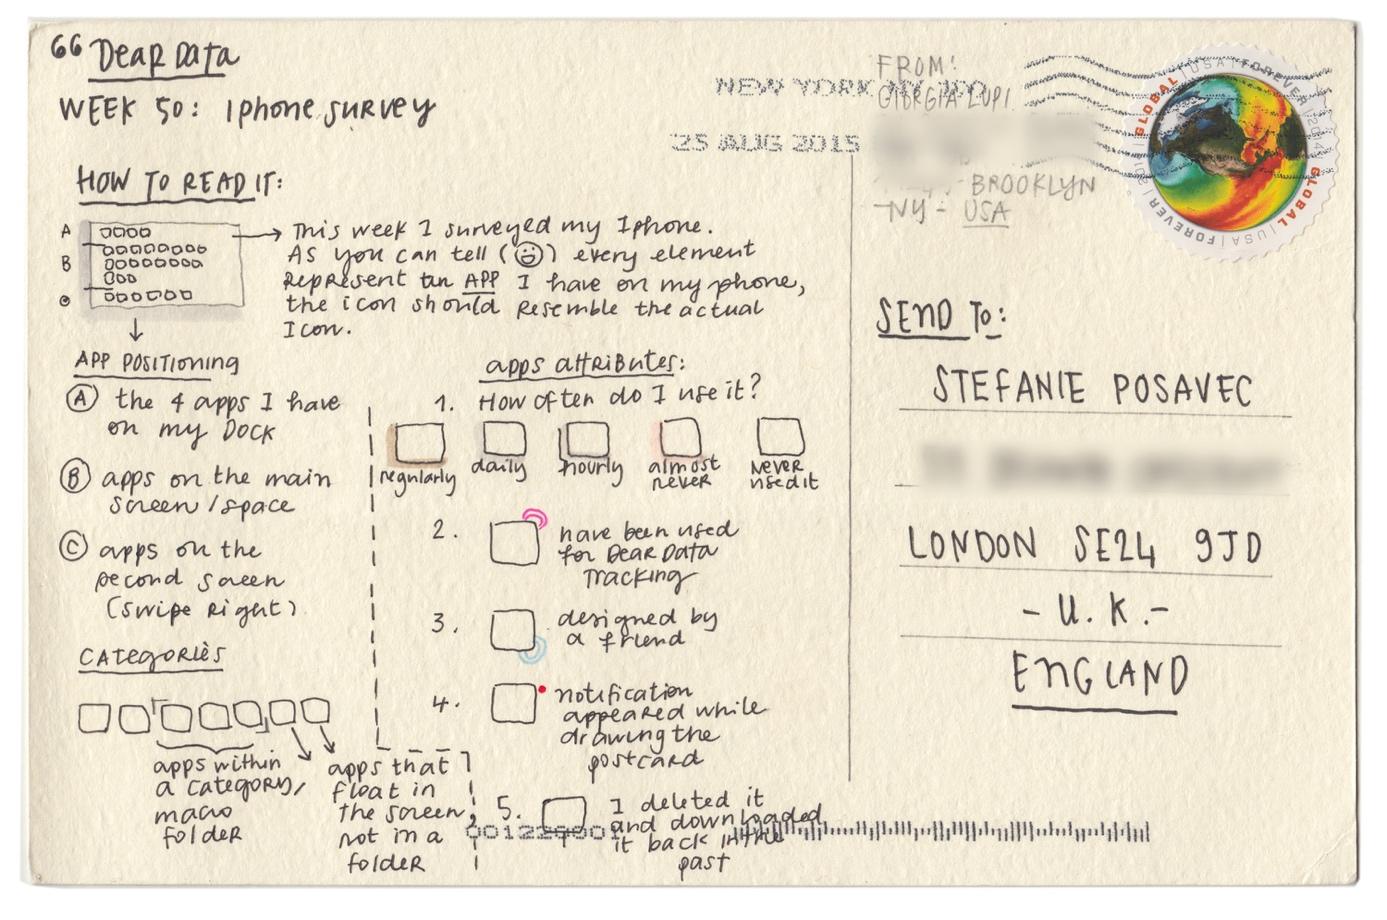
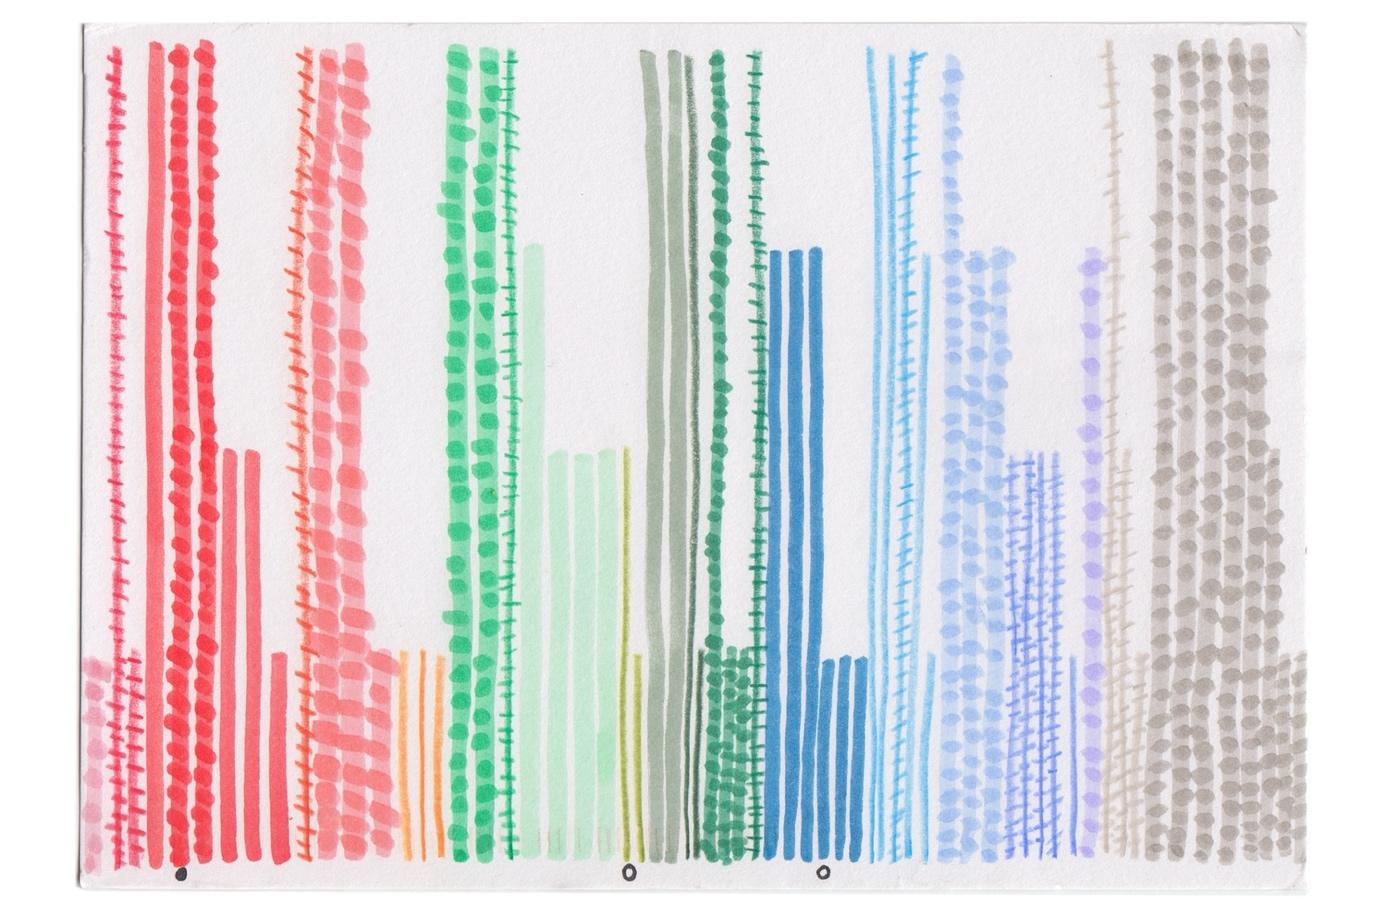
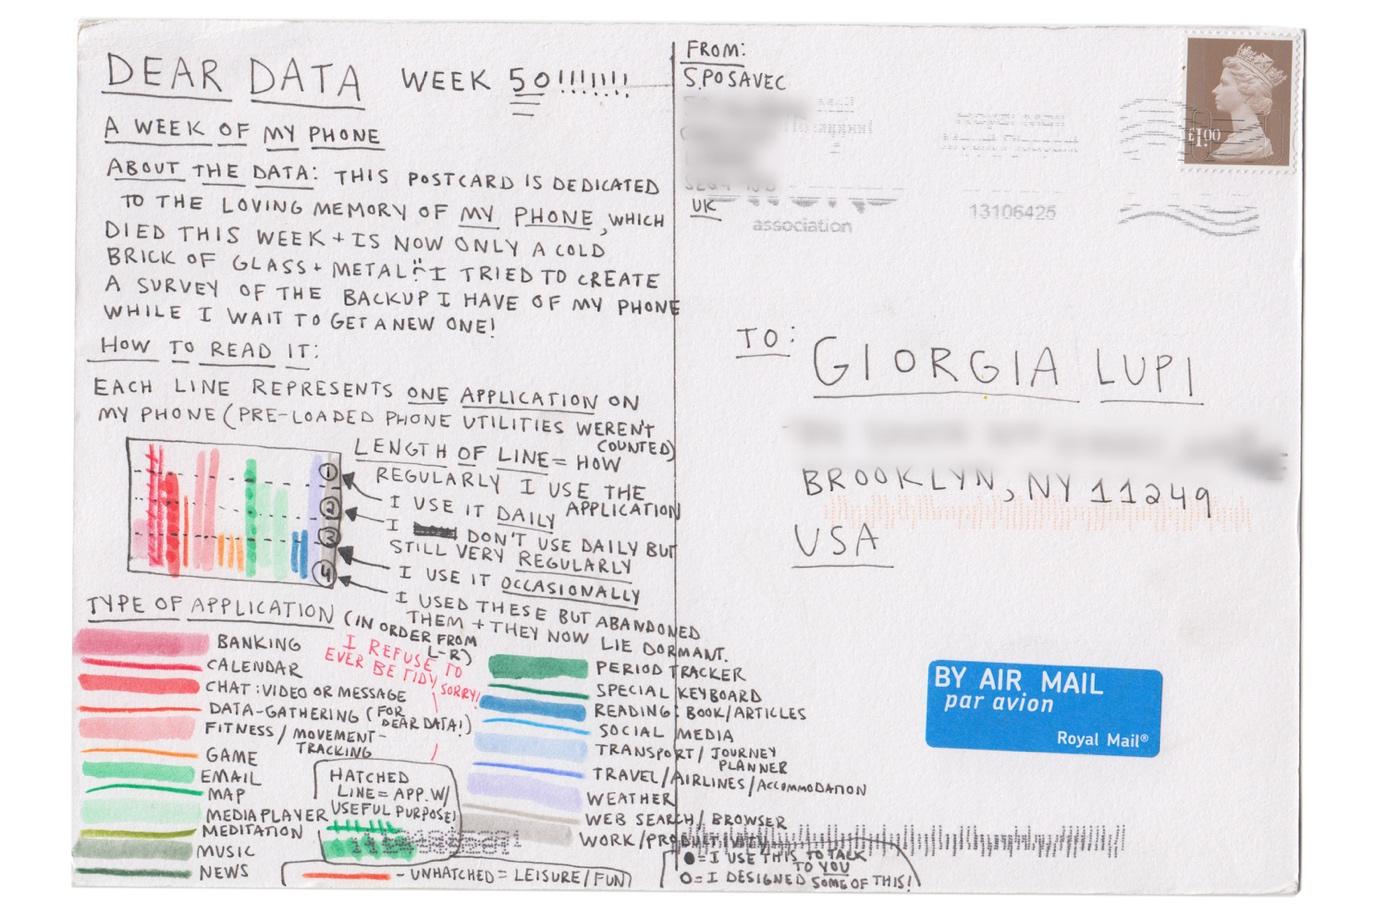
Source: http://www.dear-data.com/all
All of the examples, week by week, can be found here: http://www.dear-data.com/all.
The pupils should take the data that they collected in the evaluations above and use these to make their own visualization:
- on a postcard,
- on a sheet of A4 paper,
- on a digital poster,
- in the form of a video,
- or in any other form.
References:
Lupi, Giorgia & Posavec, Stefanie. (2013). Dear Data. http://www.dear-data.com/theproject
Lupi, Giorgia & Posavec, Stefanie. (2018). Observe, Collect, Draw! : A Visual Journal : Discover the Patterns in Your Everyday Life. Hudson, New York: Princeton Architectural.
Davis, Nicola. (2016). Can you get to know a person through data alone ? The Guardian. https://www.theguardian.com/artanddesign/2016/aug/21/dear-data-stefanie-posavec-giorgia-lupi
